The San Francisco single-family home market over the past eleven years tells a fascinating story of economic cycles, pandemic disruption, and remarkable resilience. Looking beyond the surface numbers reveals several key insights about this unique market.
Three Distinct Market Phases
The data reveals three clear market phases, each with its own characteristics:
1. Steady Appreciation Era (2014-2019)
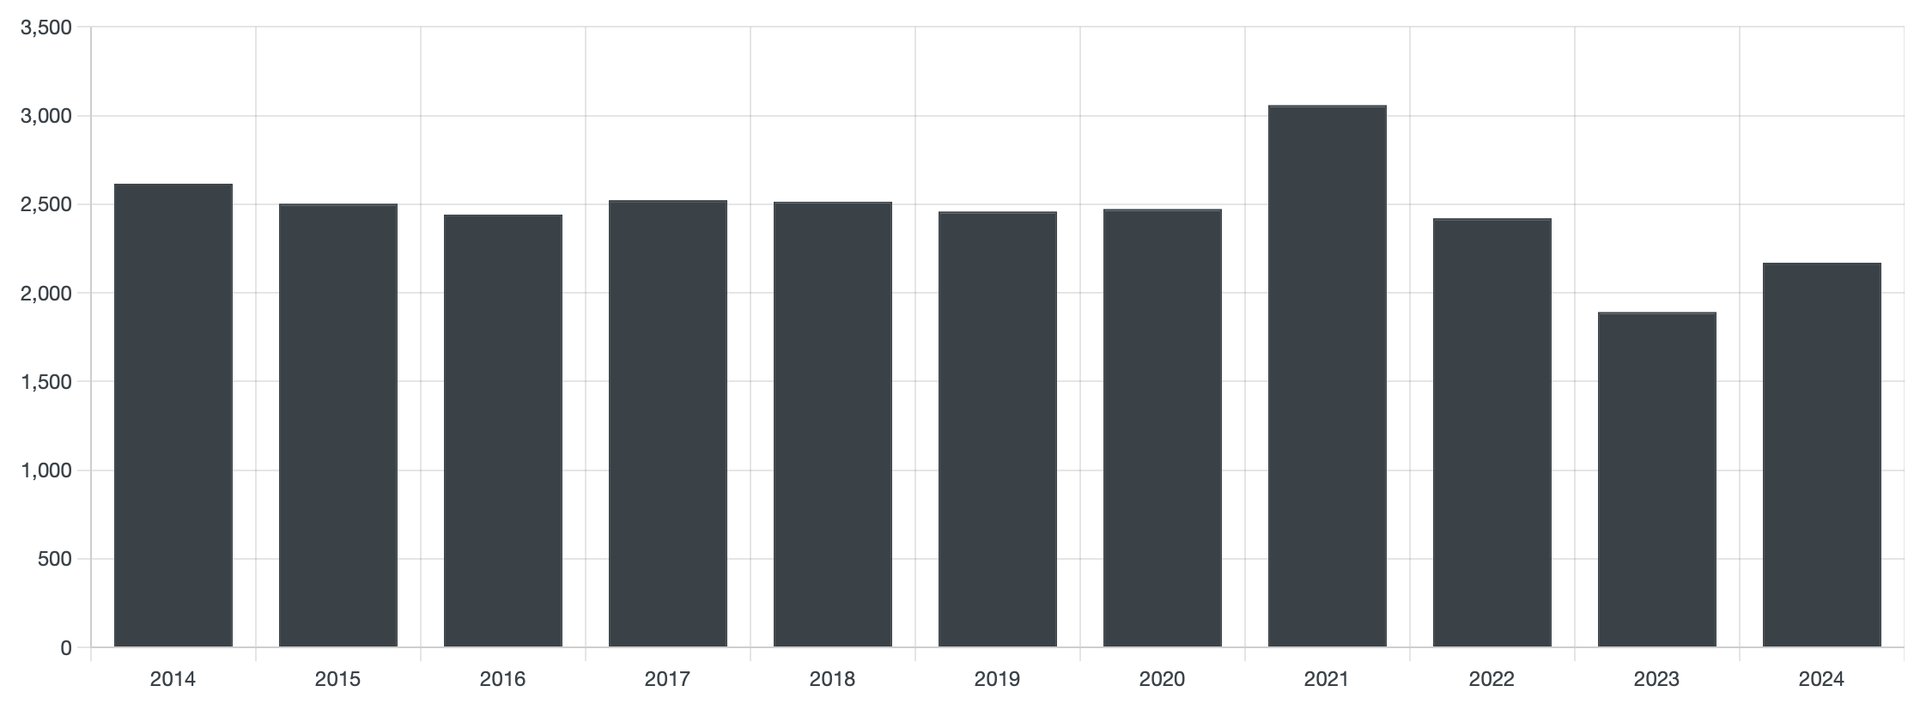
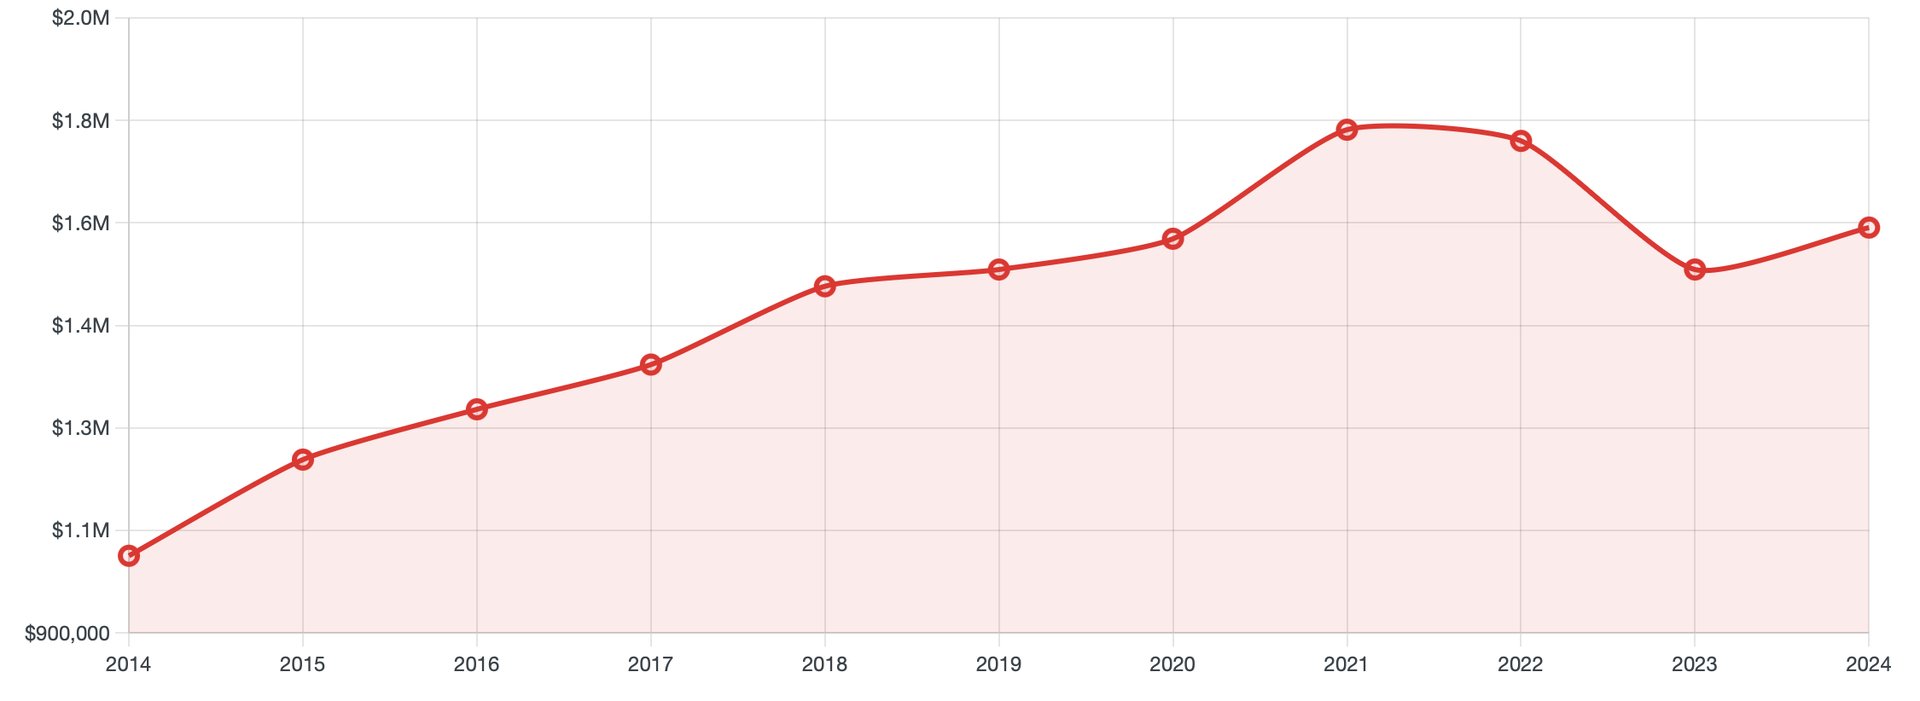
During this six-year period, San Francisco experienced consistent price growth with median values rising from $1.03M to $1.55M (+50%). This appreciation occurred against a backdrop of stable transaction volume (consistently 2,400-2,600 sales annually) and strong seller advantage (homes routinely selling above asking price).
2. Pandemic Disruption & Boom (2020-2021)
The pandemic initially created uncertainty before triggering an extraordinary demand surge driven by low interest rates. The 2021 market exhibited several remarkable characteristics:
- Record transaction volume (3,059 sales, +24% above typical years)
- Peak median price ($1.8M)
- Fastest sales velocity of the decade (12 days median DOM)
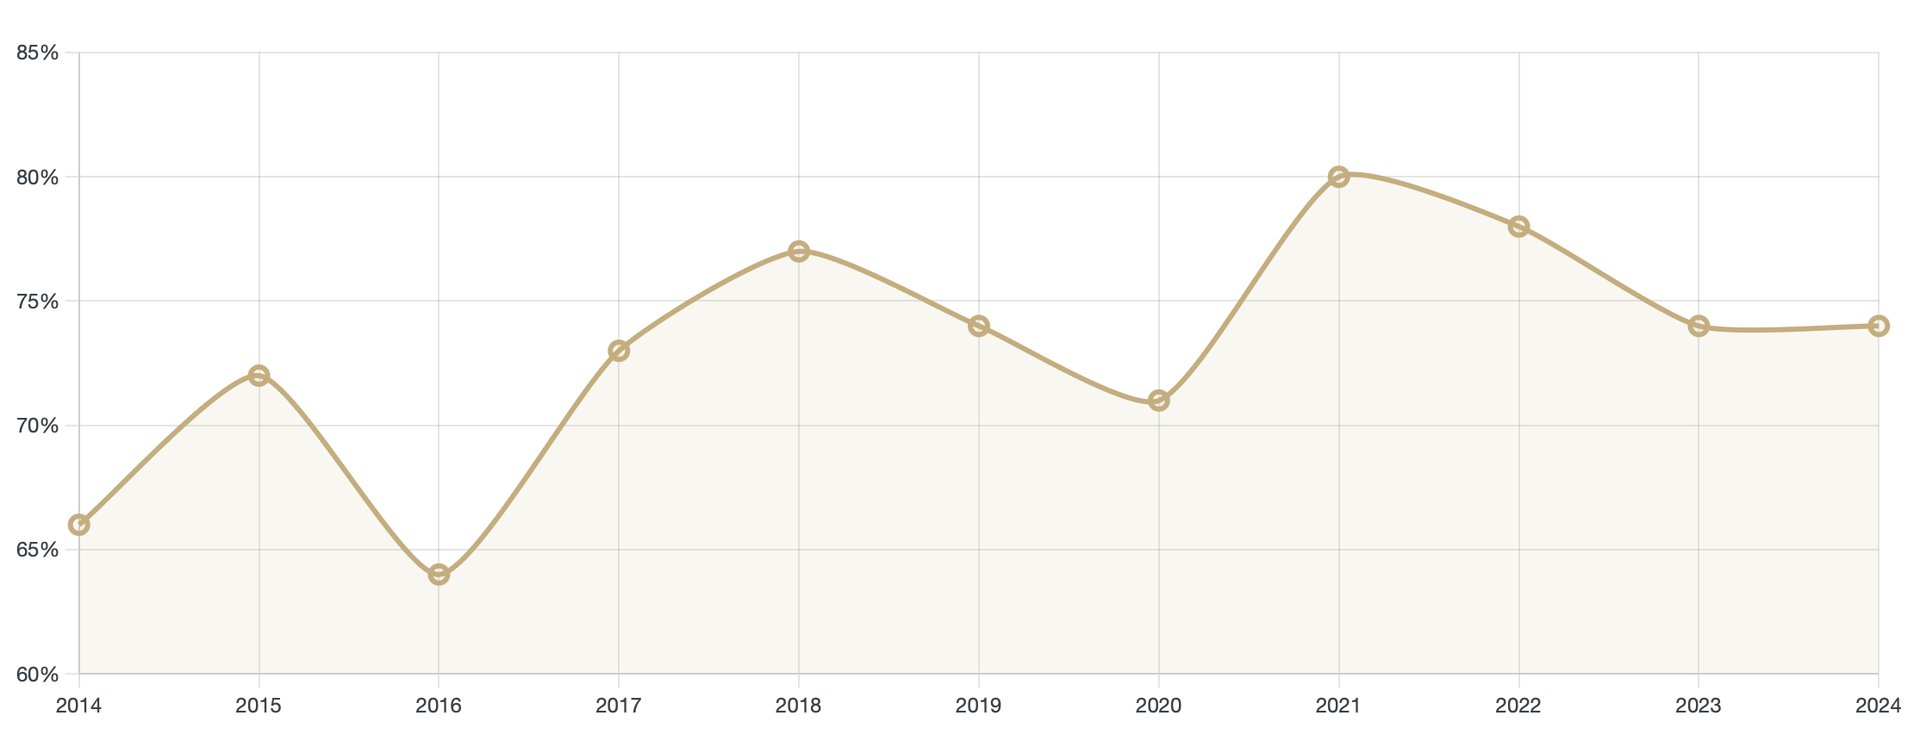
- Highest percentage of quick sales (80% of homes sold within 30 days)
3. Post-Pandemic Adjustment (2022-2024)
Rising interest rates and economic shifts triggered a market correction:
- Sharp volume contraction in 2023 (1,892 sales, -22% from 2022)
- Price correction to $1.55M (-14% from peak)
- Return to buyer leverage (SP/LP ratio below 100%)
- Recent signs of stabilization in 2024 with modest price recovery
Hidden Insights
Several patterns emerge from deeper analysis that aren't immediately obvious:
1. Price Per Square Foot Resilience
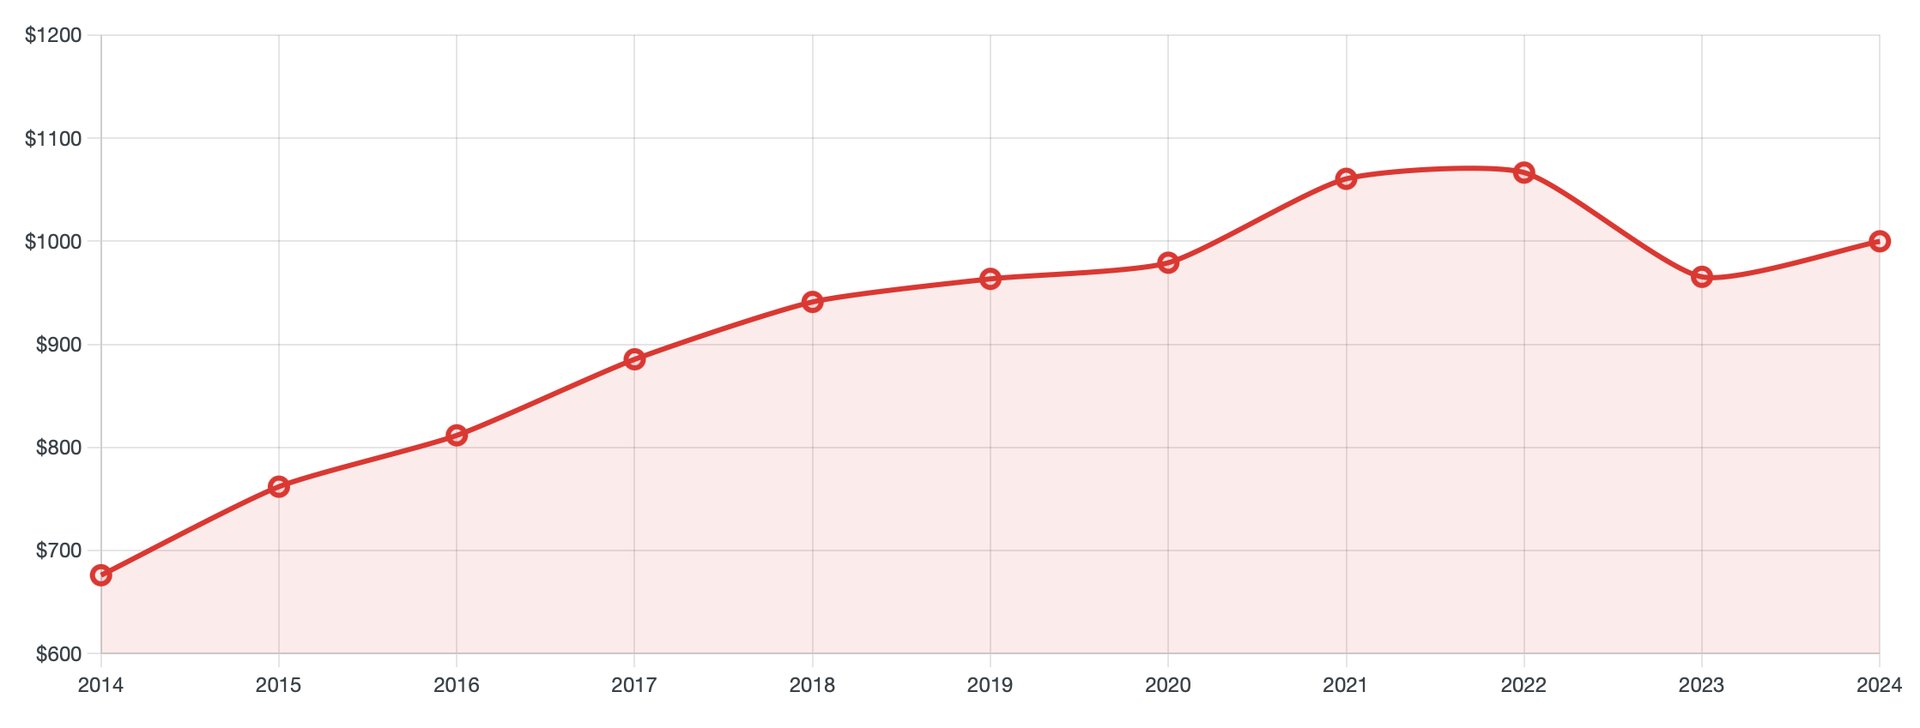
While headline prices fell 14% from peak to trough, the median price per square foot showed remarkable resilience, dropping only 10% from its peak and recovering more quickly. This suggests the correction affected higher-end properties more severely than the core market.
2. The Quick Sale Paradox
Despite market fluctuations, the percentage of homes selling within 30 days remained consistently high (64-80%) throughout the period. This reveals an important market truth: well-priced homes continued to attract buyers even during correction periods. The San Francisco market never truly "froze" - it simply became more price-sensitive.
3. Sale-to-List Price Ratio as a Leading Indicator
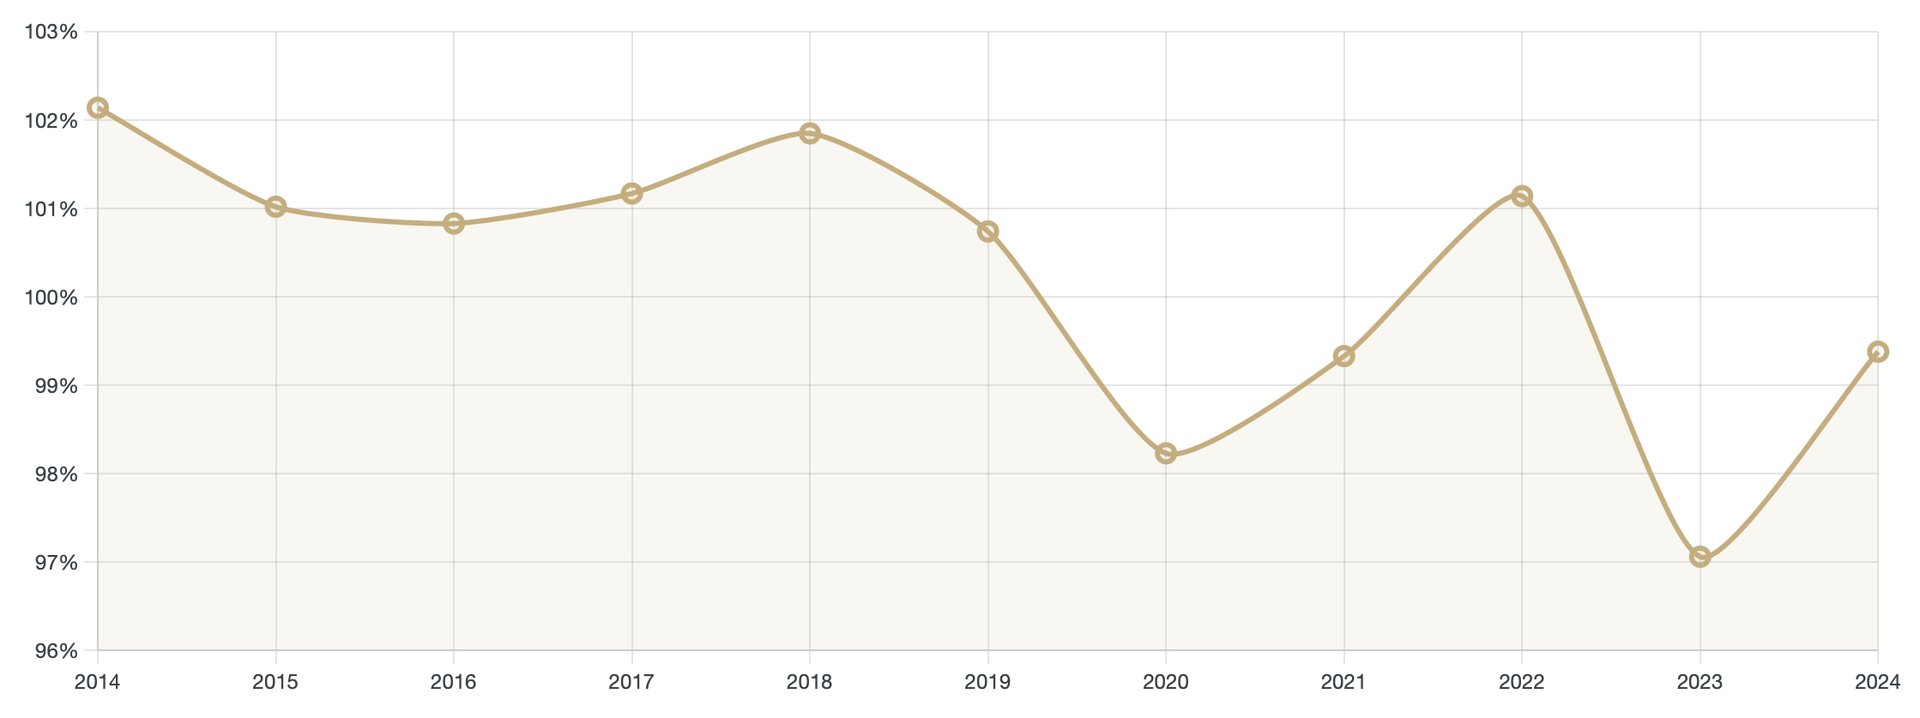
The SP/LP ratio consistently anticipated market shifts. It dropped below 100% in 2020 before the broader market peak, then rebounded briefly in 2022 before falling again in 2023. The 2024 improvement to 99.38% suggests market stabilization is underway but complete seller advantage hasn't yet returned.
4. The Price-Volume Relationship
Transaction volume appears to be a trailing indicator in this market. Volume peaked in 2021 after prices were already rising rapidly, and bottomed in 2023 after prices had already begun falling in 2022. The 2024 volume recovery (+15% from 2023) suggests buyer confidence is returning ahead of potential future price growth.
5. Long-Term Price Structure Change
Despite recent volatility, the market has undergone a fundamental restructuring. The 2024 median price ($1.625M) remains 57% higher than 2014 levels ($1.038M) - representing a compound annual growth rate of 4.6% over 11 years, outpacing inflation.
Market Position Indicators
Several metrics suggest the
San Francisco market is now approaching a new equilibrium:
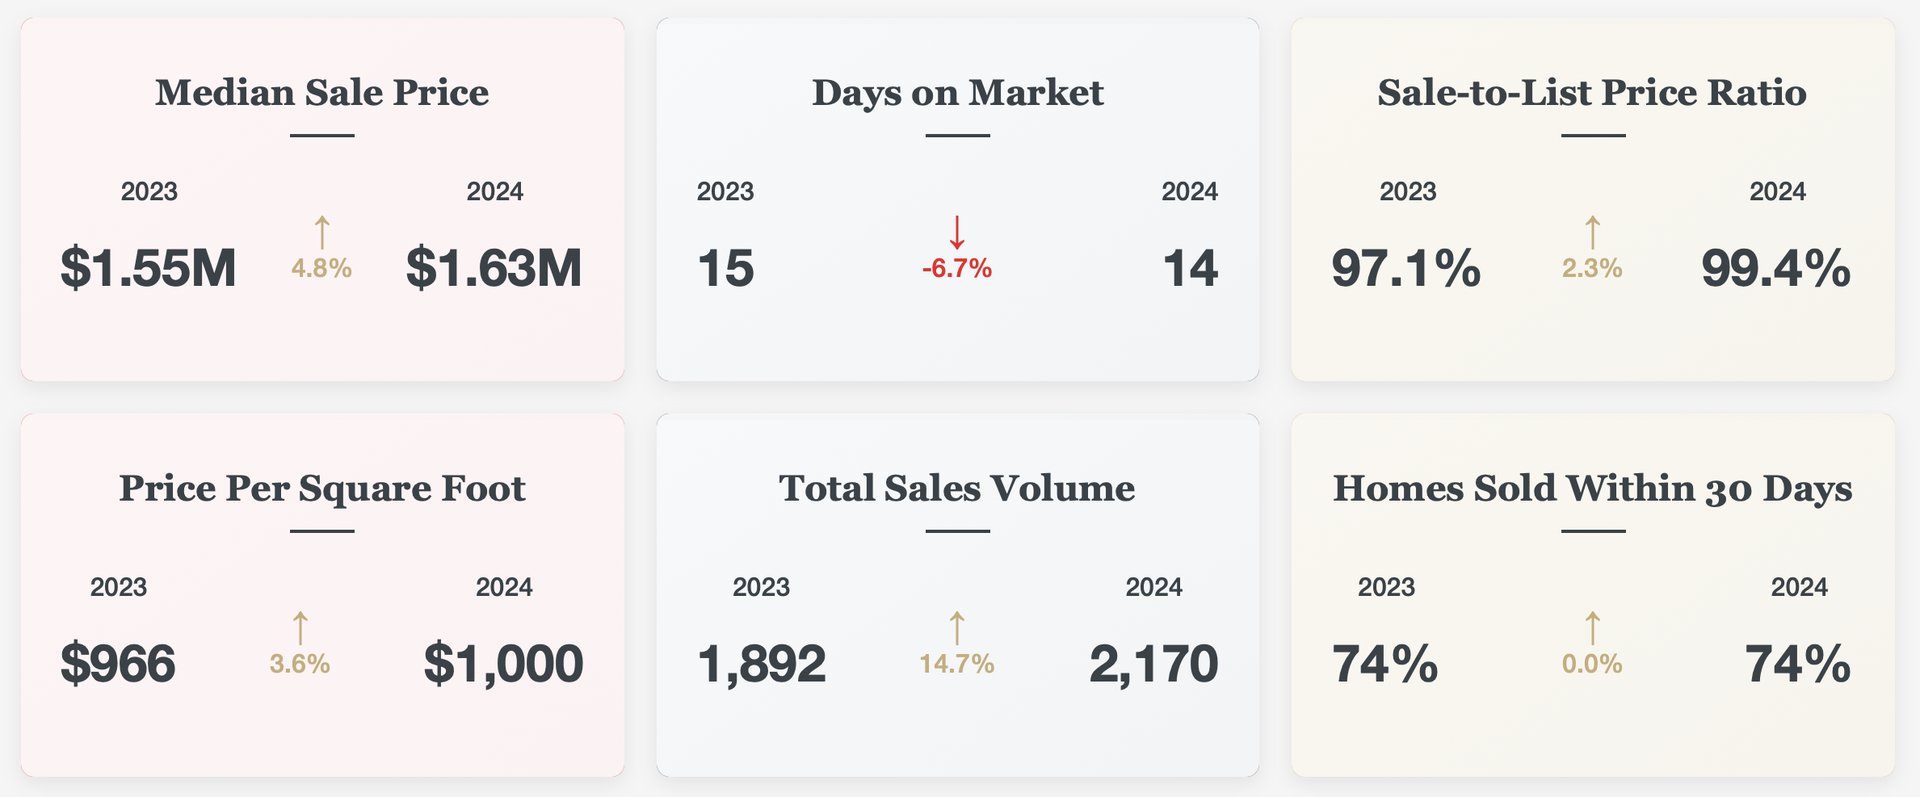
- Days on Market Stabilization: After rising to 15 days in 2023, DOM returned to 14 days in 2024 - exactly at the pre-pandemic norm.
- Price Per Square Foot Recovery: The $1,000/sqft threshold reached in 2024 represents a psychologically important level that has historically provided strong support.
- Sales Volume Recovery: The 14.7% increase in transactions from 2023 to 2024 signals renewed buyer confidence despite elevated interest rates.
- SP/LP Ratio Improvement: The trend from 97.06% in 2023 to 99.38% in 2024 suggests diminishing buyer negotiating power.
The San Francisco market has demonstrated remarkable cyclical discipline - expanding during favorable economic conditions, correcting when affordability becomes stretched, but maintaining its long-term appreciation trajectory. The data suggests the market is now finding a new equilibrium that balances realistic buyer expectations with the city's fundamental supply constraints and enduring desirability.