Southern Marin Real Estate Market: A Decade of Transformation
Cities & towns included in this "Southern Marin" aggregate analysis include Sausalito, Mill Valley, Tiburon, Belvedere, Larkspur, Corte Madera, Greenbrae, Kentfield, Ross, San Anselmo and Fairfax
Market Overview: 2014-2024
The Southern Marin real estate market has undergone a remarkable transformation over the past decade. From steady appreciation to a pandemic-fueled frenzy and subsequent recalibration, the data reveals a compelling story of one of the Bay Area's most desirable luxury markets.
The Steady Climb (2014-2019)
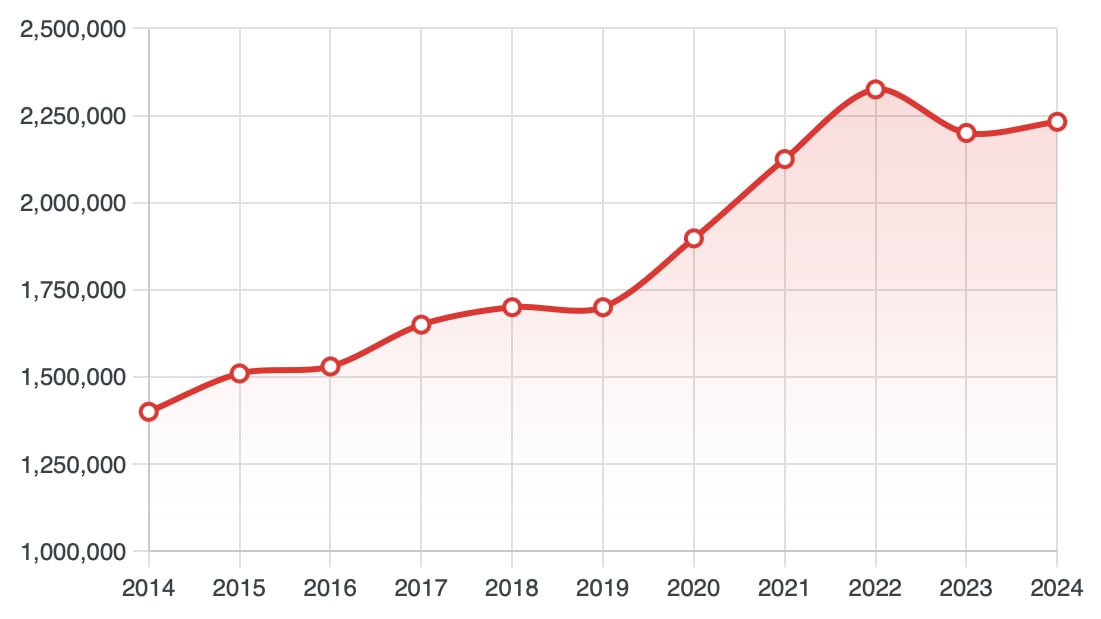
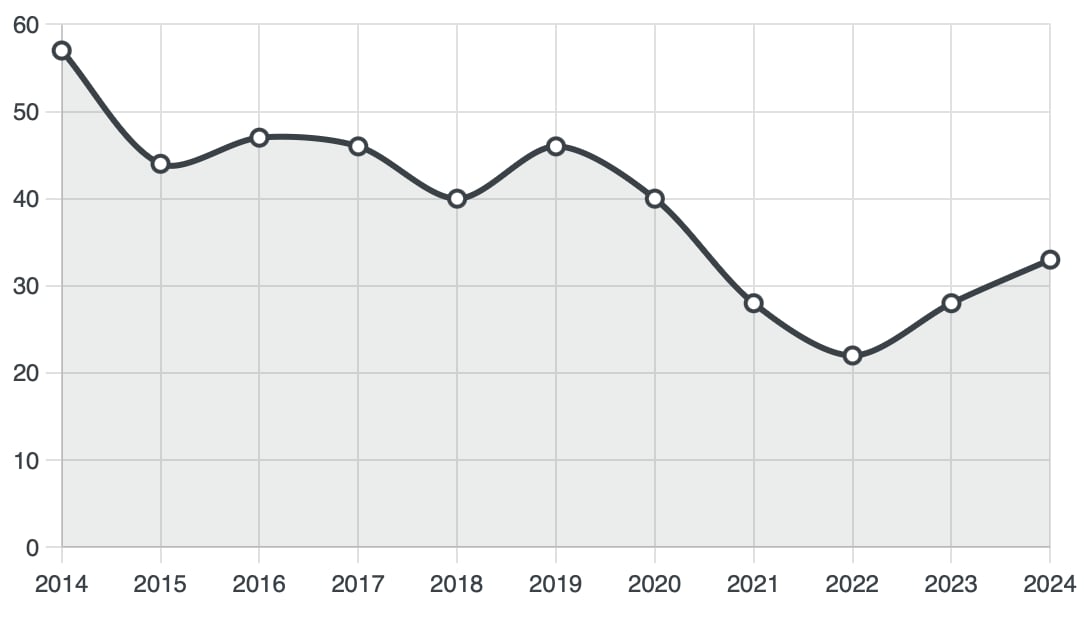
The first half of the analysis shows consistent, measured growth. Median home prices increased from $1.4 million in 2014 to $1.7 million by 2019, representing a solid 21% appreciation over five years. During this period, properties typically spent 40-57 days on market, and the sale-to-list price ratio fluctuated between 97-100%, indicating a healthy, balanced market where sellers maintained reasonable pricing expectations.
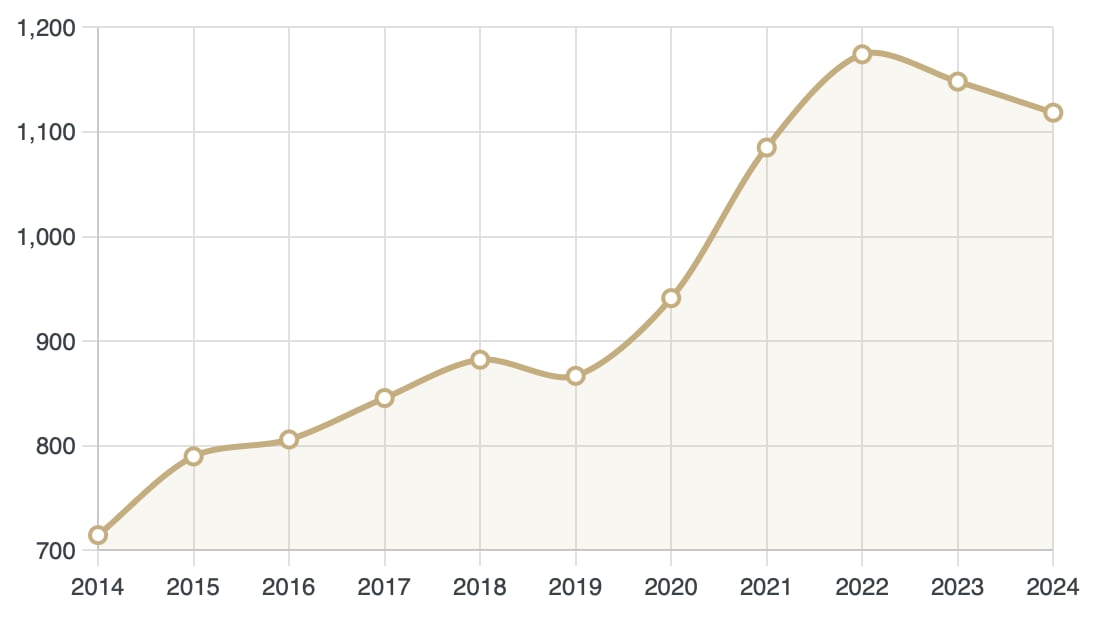
Price per square foot saw similar steady growth, rising from $714 in 2014 to $867 by 2019. This period established Southern Marin as a premium market within the greater Bay Area, with average transaction values consistently exceeding the regional median.
The Pandemic Boom (2020-2022)
Our charts reveal a dramatic market acceleration beginning in 2020 and reaching its apex in 2022. This period transformed the Southern Marin market in several key ways:
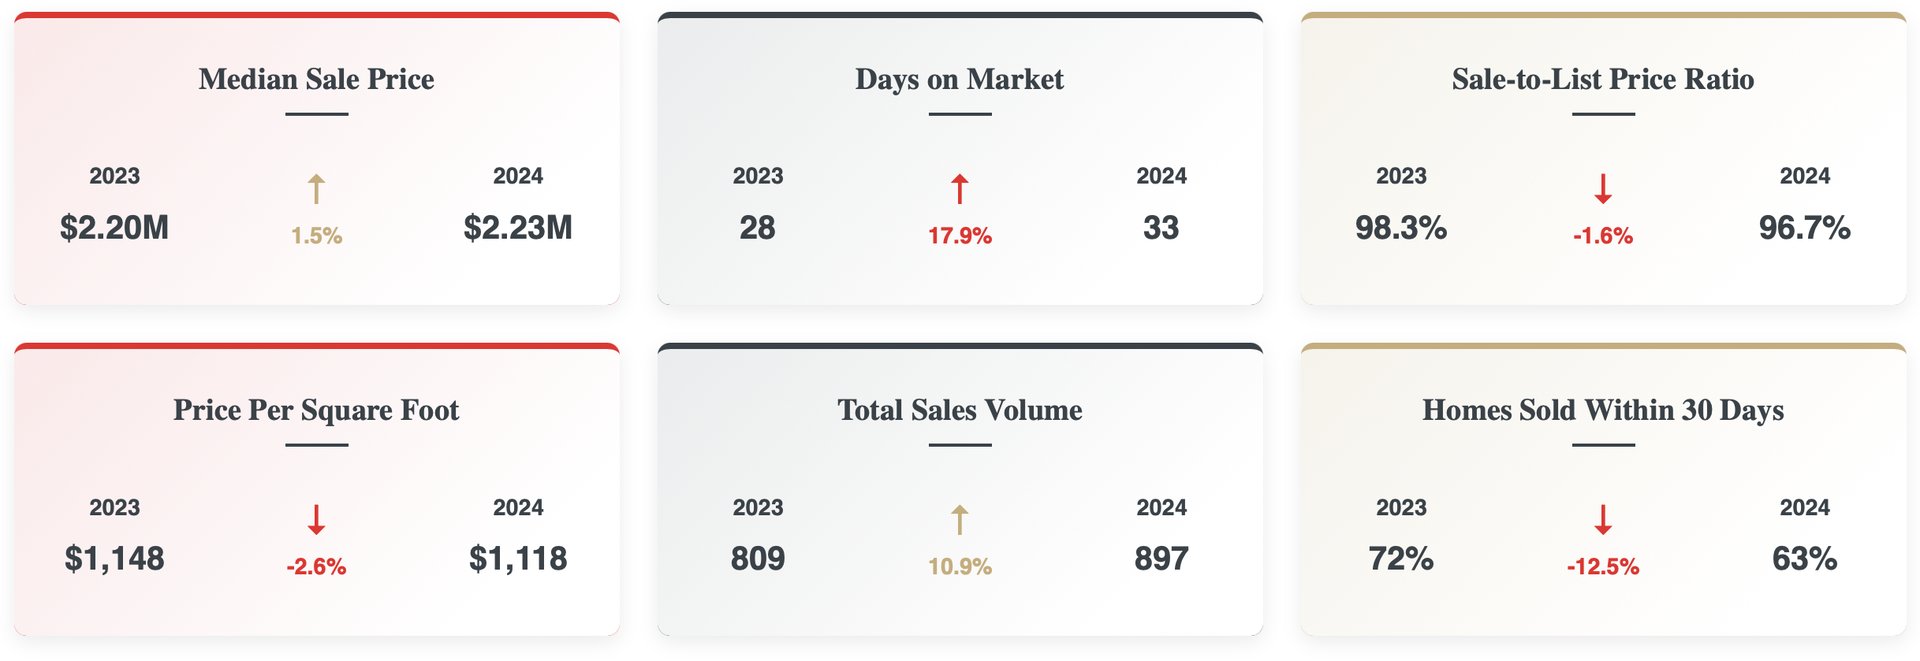
Unprecedented Price Growth: Median prices (shown below) surged from $1.9 million in 2020 to a peak of $2.33 million in 2022 – a remarkable 23% increase in just two years. Average prices climbed even more dramatically to $2.87 million, reflecting heightened luxury market activity.
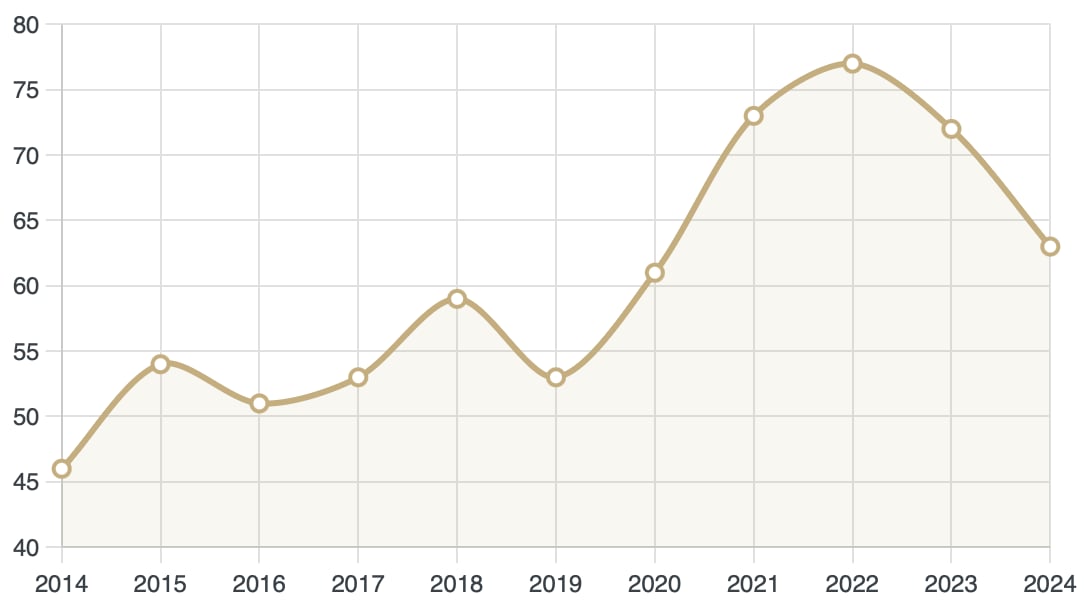
Extreme Velocity: The days on market metric plummeted to just 22 days in 2022, less than half the pre-pandemic average. Properties were moving at an unprecedented pace, with 77% of homes selling within their first 30 days on market. This was reflective of people leaving San Francisco and heading north to Marin where they placed priorities on more space and access to the outdoors.
AVERAGE DAYS ON MARKET
HOMES SOLD WITHIN 30 DAYS
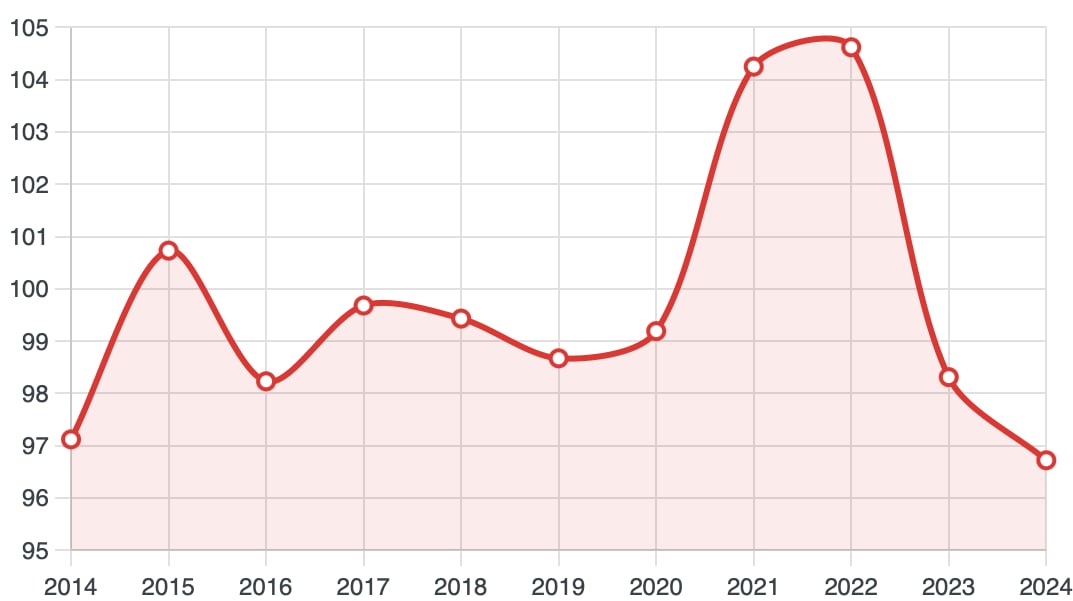
Bidding Wars Became Normal: Perhaps most telling is the sale-to-list price ratio (shown below), which soared to over 104% in 2021-2022. This reveals that the typical home was selling for approximately 4-5% above asking price – clear evidence of competitive bidding and buyer urgency. The dramatic drop from 2022 to 2023 fell right in line with the breakneck speed of rate hikes.
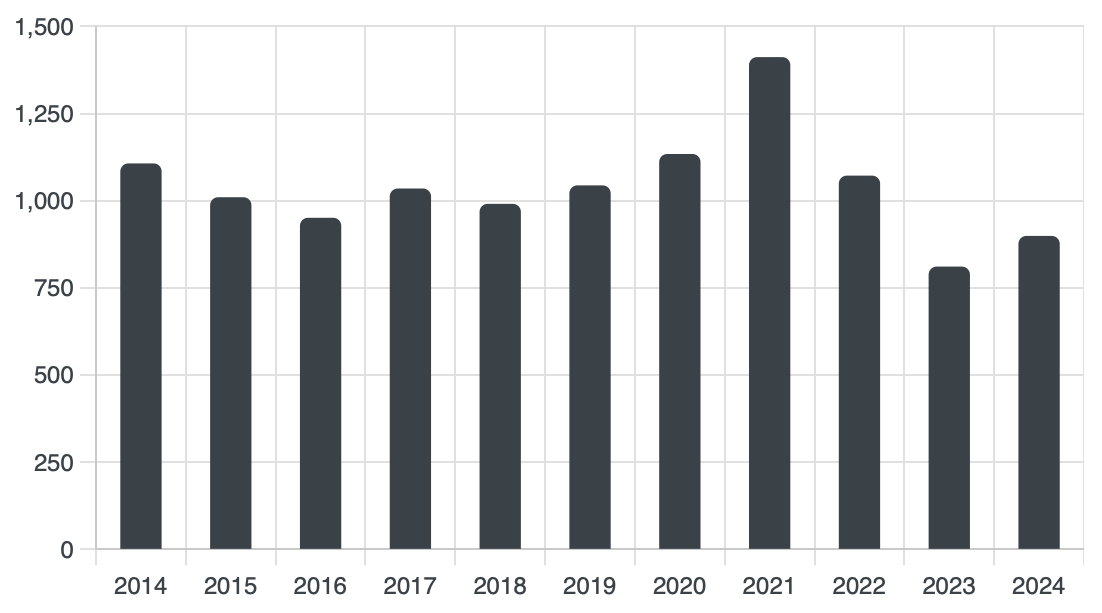
Volume Explosion: Transaction volume reached a decade high of 1,410 sales in 2021, representing a 36% increase from pre-pandemic levels. This surge reflected both heightened demand and increased inventory as some homeowners capitalized on the seller's market.
The Recalibration (2023-2024)
The most recent data points to a market recalibration rather than a correction:
Price Stabilization: After reaching peak values in 2022, median prices moderated to $2.23 million in 2024 – a 4% decline from the peak but still 59% higher than 2014 levels. The comparison between median and average prices suggests fewer ultra-luxury transactions than during the pandemic peak.
Balanced Negotiations: The sale-to-list price ratio has returned to 96.7%, indicating buyers have regained some negotiating leverage. Most homes are now selling slightly below asking price, in contrast to the above-asking transactions that dominated 2021-2022.
Normalized Pace: Properties now spend an average of 33 days on market – longer than during the pandemic frenzy but still well below the pre-pandemic norm. About 63% of homes sell within their first month on market, showing continued strong demand despite cooling conditions.
Recovery in Volume: After falling to 809 transactions in 2023 (the decade's lowest point), sales volume has begun recovering with 897 sales in 2024, suggesting renewed market confidence.
What This Means for Market Participants
For Buyers
The data suggests a more favorable environment for buyers than during the pandemic peak. With properties typically selling slightly below asking price and staying on market longer, buyers now have time for due diligence and the ability to negotiate. However, properties priced correctly and in desirable locations still move quickly, with prices remaining historically high, and buyers most likely have to have very strong terms in order to get into these properties.
For Sellers
While the extreme seller's market of 2021-2022 has moderated, conditions remain historically favorable for sellers. Properties that are well-presented and appropriately priced continue to sell within a reasonable timeframe, and values remain significantly higher than pre-pandemic levels.
The key shift is in pricing strategy – the data clearly shows that the days of automatic bidding wars and significant over-asking sales have largely passed. Setting realistic expectations based on current market conditions rather than peak pandemic values is essential.
For Investors
The price per square foot metric provides valuable insight for investors. Despite the recent moderation, the long-term appreciation trend remains strong. The widening gap between average and median prices during market peaks suggests that premium properties experience the most volatility during both upswings and downturns.
Unique Characteristics of Southern Marin
Several patterns in the data highlight what makes the Southern Marin market unique:
-
Resilience: Even during market adjustments, values have maintained most of their pandemic-era gains, demonstrating the area's enduring appeal.
-
Luxury Influence: The consistent gap between average and median prices reveals the significant influence of high-end properties on market statistics.
-
Cyclical Patterns: The data shows Southern Marin follows broader market cycles but with muted downturns, reflecting the limited supply and consistent demand for homes in these desirable communities.
-
Supply Constraints: The relatively stable inventory levels highlight development/new construction limitations that help maintain property existing values over time.
Looking Ahead
While no real estate analysis can predict the future with certainty, the current data suggests that the market is finding its equilibrium after the extraordinary conditions of the pandemic era. Strong fundamentals have long made Southern Marin desirable – exceptional schools, proximity to San Francisco, natural beauty, and limited supply – and they remain unchanged.
The moderating pace and slight price adjustments appear to represent a healthy normalization rather than a fundamental market shift, creating a more sustainable environment for both buyers and sellers as we move forward.
Looking deeper into the data reveals several fascinating patterns that aren't immediately apparent but provide valuable insights into market dynamics:
1. The Luxury Market Amplification Effect
The relationship between average and median prices tells a hidden story about wealth concentration. During 2021-2022, the gap between these metrics widened dramatically, with average prices climbing 27% higher than median prices (compared to just 18-20% in pre-pandemic years). This indicates that the pandemic boom wasn't just about overall appreciation but was particularly amplified in the ultra-luxury segment. The data suggests the wealth surge during this period disproportionately flowed into premium properties, likely one of the many manifestations of the Cantillon Effect, which we've written about in our newsletter.
2. Market Polarization in Buyer Behavior
The weighted sale-to-list price analysis reveals a striking market polarization that simple averages obscure. During the peak boom (2021-2022):
- Properties selling within 30 days commanded extraordinary premiums (often 10%+ above asking)
- Properties not selling within 60 days faced severe discounts (as low as 82-85% of asking)
This "barbell effect" created a winner-takes-all market where desirable properties saw frenzied bidding while less optimal properties languished - a polarization far more extreme than typical market conditions.
3. Early Warning System in Market Velocity
The percentage of homes selling within 30 days provides a leading indicator for price trends that's not obvious from price data alone. This metric peaked at 77% in 2022, then declined to 72% in 2023 before prices showed significant moderation. The data suggests monitoring this metric can provide an early warning system for market shifts - when the percentage drops 5+ points, price adjustments typically follow 6-12 months later.
4. The Hidden Resilience Factor
Despite the market cooling from its peak, the median price has held much firmer than days-on-market and sale-to-list price ratios would suggest. While DOM increased 50% from peak (22 to 33 days) and SP/OP ratio fell by 8 percentage points (104.6% to 96.7%), median prices declined just 4% from peak. This indicates Southern Marin sellers possess unusual holding power - they're choosing to wait rather than accept significant discounts, creating price stability despite cooling demand. This holding power is also likely due to the "lock-in effect", whereby property owners are choosing to stay in their homes for longer periods due to low interest rates they locked in.
5. Counterintuitive Pricing Strategy Implications
The data reveals a fundamental shift in optimal pricing strategy that's not obvious from headline numbers. During the hot market (2021-2022), setting an artificially low asking price likely yielded higher final results through bidding wars. Today, with sale-to-list ratios below 100%, this strategy can be counterproductive for some property types. The Binnings Team can help in deciphering which strategy will work best for your home.
6. The Volume Anomaly
Conventional wisdom suggests transaction volume and prices move in the same direction. Yet 2021 shows an interesting anomaly - it had both the highest transaction volume (1,410 sales) and some of the highest price appreciation. This challenges the traditional supply-demand model and suggests pandemic-era buyers were uniquely undeterred by rising prices, perhaps due to record-low interest rates, remote work flexibility, and wealth effects from stock market gains. 2021 could be looked at as a "momentum" year, a term used in stock trading.
7. The Property Size Premium Shift
Examining the price per square foot trend ($714 in 2014 to $1,118 in 2024) against total prices reveals a subtle shift in the value premium for larger properties. Pre-pandemic, there was a steeper discount for additional square footage (larger homes had lower per-square-foot costs). Post-pandemic, this size discount has narrowed, indicating buyers now place relatively higher value on additional living space - likely influenced by remote work arrangements that make home offices and flexible spaces more valuable.
These insights highlight how careful analysis of the data can reveal deeper structural changes in the market beyond the headline price trends, providing more nuanced understanding of Southern Marin's real estate dynamics. Contact The Binnings Team if we can provide more information!